Analytics in Logistics and Supply Chain Management
This article explores analytics within logistics and its impact on supply chain efficiency, covering its history, applications, and future trends.
Updated
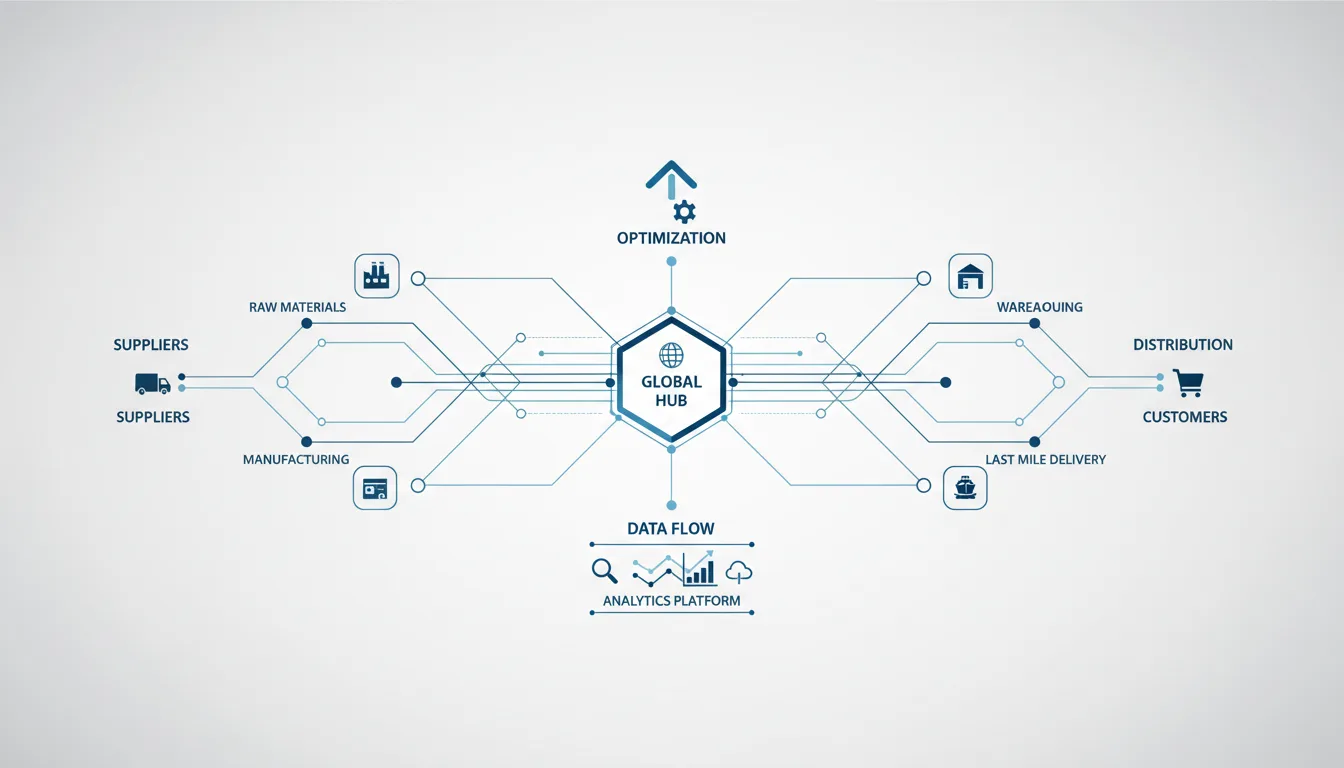
Analytics in Logistics and Supply Chain Management
Overview
Analytics in logistics refers to the systematic computational analysis of data in order to inform decision-making throughout the supply chain. This process transforms raw data into substantial insights that drive operational efficiency, enhance customer satisfaction, and reduce costs. In today's fast-paced market, logistics analytics has become an essential component of supply chain management, enabling organizations to optimize routes, forecast demand, manage inventory, and streamline operations. According to a report by Deloitte, organizations employing advanced analytics in their supply chain functions have seen up to a 15% improvement in overall efficiency, highlighting the tangible benefits of a data-driven approach.
Etymology and Origins
The term "analytics" derives from the Greek word "analusis," which means "breaking up" or "unloosening." The first documented usage of the term in English, referring to the method of analyzing, dates back to the late 17th century, specifically in the field of logic. Its application evolved to encompass a wide range of statistical and data-driven methods used for decision-making. Initially, analytics was primarily associated with mathematics and logic, but as computational technologies developed, its application expanded significantly, especially in commerce, scientific research, and eventually, logistics and supply chain management.
Historical Evolution
The application of analytics in logistics has undergone a profound transformation, closely paralleling technological advancements and economic shifts. From manual record-keeping to sophisticated AI-driven systems, the journey reflects a continuous quest for greater efficiency and foresight.
Early Foundations (Pre-1950s): Before the advent of modern computing, logistical analytics was rudimentary. Businesses relied on manual inventory counts, basic ledger systems, and empirical observations to manage goods. Early forms of demand forecasting were often based on historical sales data and seasonal patterns, calculated by hand.
The Dawn of Operations Research (1950s-1960s): The post-World War II era saw the emergence of Operations Research (OR), a discipline that applied scientific methods to management problems. Pioneers like George Dantzig developed linear programming in the late 1940s, providing mathematical frameworks for optimizing resource allocation, including transportation routes and production schedules. The development of the Economic Order Quantity (EOQ) model by Ford W. Harris in the early 20th century, though formalized later, became a cornerstone for inventory optimization, utilizing analytical methods to balance ordering and holding costs. During this period, the first mainframe computers began processing large datasets, laying the groundwork for computerized logistics solutions.
Material Requirements Planning (MRP) and Early Software (1970s): The 1970s witnessed the widespread adoption of Material Requirements Planning (MRP) systems. Championed by individuals like Joseph Orlicky at IBM, MRP systems revolutionized manufacturing by using master production schedules to calculate raw material and component needs, optimizing procurement and production. These systems were early examples of analytics directly influencing operational decisions, moving beyond simple record-keeping to predictive planning.
Just-In-Time, Barcodes, and EDI (1980s): The 1980s were marked by the proliferation of Just-In-Time (JIT) manufacturing principles, prominently at Toyota under Taiichi Ohno, which emphasized minimizing inventory and optimizing production flow based on demand. This approach inherently required sophisticated analytical capabilities to manage supplier relationships, production schedules, and demand forecasting with precision. Concurrently, the widespread adoption of barcodes dramatically improved data capture accuracy and speed in warehouses and retail, enabling more granular inventory tracking. Electronic Data Interchange (EDI) also emerged as a standard for inter-organizational communication, facilitating data exchange across the supply chain.
ERP and Data Warehousing (1990s): The 1990s saw the rise of integrated Enterprise Resource Planning (ERP) solutions from companies like SAP and Oracle. These systems integrated various business functions, including logistics, finance, and human resources, into a single platform, enhancing data visibility across an organization. The concept of data warehousing gained traction, allowing companies to consolidate and analyze vast amounts of historical data for strategic decision-making, moving beyond transactional reporting to business intelligence.
E-commerce and Advanced Analytics (2000s): The explosion of e-commerce in the early 2000s created unprecedented demand for rapid, accurate, and cost-effective logistics. This spurred the development of more advanced analytical techniques, including sophisticated demand forecasting models, route optimization algorithms, and network design tools. Businesses began leveraging Business Intelligence (BI) platforms to gain deeper insights into operational performance and customer behavior.
Big Data, Predictive Analytics, and IoT (2010s): The 2010s ushered in the era of Big Data, characterized by the immense volume, velocity, and variety of data generated. This led to significant advancements in predictive analytics, utilizing machine learning and statistical models to forecast future events, such as demand fluctuations or potential disruptions. The Internet of Things (IoT) began to connect physical assets, like delivery vehicles and warehouse equipment, generating real-time data that enabled dynamic optimization and enhanced visibility, crucial for applications such as mobile warehouse management.
AI, Prescriptive Analytics, and Digital Twins (Present): Recent advancements include the widespread integration of Artificial Intelligence (AI) and machine learning algorithms, enabling not just predictive but also prescriptive analytics. These systems can recommend specific actions to optimize operations, such as suggesting optimal inventory levels or rerouting shipments in real-time. The development of digital twins, virtual replicas of physical supply chains, allows for scenario planning and optimization in a risk-free environment. Technologies like blockchain are also being explored for enhancing supply chain transparency and traceability.
Best Practices for Analytics in Logistics
Implementing analytics requires an organization-wide commitment to data-driven decision-making and can be achieved through several key best practices:
-
Data Quality and Integrity: Ensuring that data is accurate, complete, and timely is crucial for effective analytics. Poor data quality can lead to flawed insights and suboptimal decisions. Implementing robust data validation processes, integrating real-time data capture mechanisms like those found in a mobile WMS, and establishing clear data governance policies are essential. Regular cycle counting and detailed tracking of lots and expiration dates are specific examples of practices that enhance data integrity for inventory management.
-
Integration of Systems: Avoiding data silos by integrating various logistics systems allows for comprehensive data analysis and a holistic view of the supply chain. Solutions such as order management systems, Warehouse Management Systems (WMS), Transportation Management Systems (TMS), and Enterprise Resource Planning (ERP) should communicate seamlessly. A unified integrations hub can streamline this process, enabling data to flow freely and providing a single source of truth across the supply chain, facilitating end-to-end visibility from purchase order management to order fulfillment.
-
Visualization and Reporting Tools: Leveraging advanced visualization tools can help stakeholders understand complex data and trends at a glance. Creating dashboards that display key performance indicators (KPIs) can motivate all team members to align with business objectives and enable quick, informed responses. For example, visualization software can turn raw sales data into interactive charts that highlight trends over time, helping to identify bottlenecks or opportunities for warehouse layout optimization or stock replenishment strategies.
-
Skilled Talent and Data Culture: Investment in analytics tools must be complemented by investment in the people who use them. This includes hiring data scientists, logistics analysts, and training existing staff in data literacy. Fostering a data-driven culture, where decisions are challenged and supported by evidence, is paramount. This cultural shift ensures that insights generated by analytics are actually acted upon and integrated into strategic and operational planning.
-
Continuous Improvement: Analytics is not a one-time project but an ongoing process. Regularly review analytics outcomes, assess the effectiveness of implemented strategies, and adjust models and approaches accordingly. This iterative process echoes the Plan-Do-Check-Act (PDCA) cycle prominent in lean management, which emphasizes the importance of iterative processes in operational efficiency. Utilizing workflows to automate reporting and trigger alerts can support this continuous improvement loop.
Case Studies
1. Amazon
Amazon has leveraged analytics to create one of the most efficient logistics networks in the world. Using data-driven insights, the company optimizes delivery routes, anticipates customer demand, and significantly reduces shipping times. Their sophisticated use of predictive analytics allows them to strategically position inventory across a vast network of fulfillment centers, enabling same-day or next-day delivery for millions of products. This analytics strategy has helped Amazon achieve over 200% ROI on its investments in logistics technology, leading to a significant edge in a competitive e-commerce market by continuously enhancing customer satisfaction and operational speed.
2. Walmart
Walmart employs advanced analytics to manage its supply chain effectively, including inventory optimization across thousands of stores and warehouses. By using real-time data from sales transactions, weather patterns, local events, and even social media trends, the company can predict demand fluctuations with remarkable accuracy. This allows them to adjust inventory levels proactively, reducing instances of stockouts and overstocking. Walmart's data strategy integrates real-time data processing to ensure the right products are in stock when needed, enhancing customer satisfaction and reportedly achieving a 10% reduction in overall inventory costs. Their use of predictive analytics extends to optimizing store layouts and product placement based on purchasing behavior.
Conclusion
As technology continues to advance, the role of analytics in logistics and supply chain management will only become more critical. Organizations that embrace and effectively utilize analytics can expect to see substantial improvements in efficiency, customer satisfaction, and cost reduction. The ongoing evolution of AI and machine learning will continue to shape the landscape, making continuous adaptations necessary to stay competitive. The successful integration of these analytics tools, from basic data capture to advanced visual inventory management systems and pick, pack, ship software, can provide businesses with a unique advantage in an increasingly data-driven marketplace. By focusing on data quality, system integration, skilled talent, and continuous improvement, companies can unlock the full potential of logistics analytics to build more resilient, efficient, and responsive supply chains.
Sources
- Just-In-Time Overview
- Material Requirements Planning
- What is Artificial Intelligence?
- Plan-Do-Check-Act Cycle
- How Amazon Built the Fulfillment Network of the Future
- Walmart's Data Strategy
- analytics, n.
- What is Operations Research?
- George Dantzig and Linear Programming
- Inventory Management
- Joseph Orlicky
- The Inventor of the Toyota Production System, Taiichi Ohno
- The History of the Bar Code
- What is a Data Warehouse?
- What is Business Intelligence?
- What is Predictive Analytics?
- What is Prescriptive Analytics?
- What is a Digital Twin and Why it Matters
- Integrations Hub
- Purchase Order Management
- Order Fulfillment Guide
- Warehouse Layout Preview
- Stock Replenishment Guide
- Cycle Counting Guide
- Lots & Expiration Dates
- Workflows Overview
- The Amazon Delivery Machine
- How Walmart Uses Big Data to Stock Its Shelves
- Visual Inventory System
- Pick, Pack, Ship Software